
By Len In General
Many have already speculated on FED’s plan to increase interest rate, but had not expected it to happen really soon. Just few weeks ago, borrowers are now again hit by a 0.25% increase of interest rates on their loans due to FED’s low optimism on current market policies and trends. This would be the third time hike since crisis have affected US financially. This might not be a good news to all, but policy like this was surely deliberated with confidence, aiming to stabilize the country’s economic stand after all. So, why don’t we take a look on a bright side of it?
Increasing interest rates is positively affecting financial institutions like banks which main income comes from interest. If you have invested or planning to add banks to your portfolio, this is the right time to check interest income if truly has uprising turn. Let’s take a peek on what we could learn in analyzing bank income against non-bank expense.
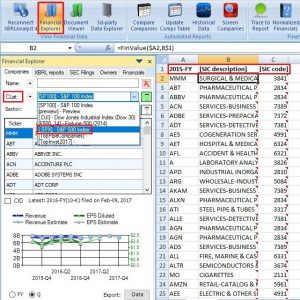
By using XBRLAnalyst in Excel, we chose the top performing banks in the market by searching in any of the 4 predefined market indexes available in Financial Explorer under “Company List/Clist”. On this example, we will use S&P 500 index. Export to excel all the company tickers and filter those belonging to “Bank” sector by getting each companies [SIC Description] or [SIC Code] thru Finvalue or XBRLFact function.

After filtering, take each bank’s “Interest Income” from year 2011 to 2016 and calculate per year average increase.

After getting banks, now filter for non-bank companies and do the same averaging but for “Interest Expense” account.

And finally, we will be comparing both sides by plotting on a line graph. This will enable us to get a visual effect on how companies respond to economic indicator such as interest rate.
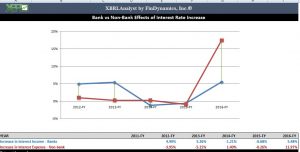
As you would notice, companies are having slow or almost no reaction on interest rates for the past 4 years, not until last year 2016 when companies have started to pay a huge chunk of their loans, and of course interest expense. From a point-to-point relationship in 2015, the first interest rate hike totally pushed them apart. We might either anticipate to grow a larger space between these two or a parallel movement heading up.
Factors like this affecting income should not be really missed. And with XBRLAnalyst, data presentation is now easier. We started here with S&P500, but you can still run your test for the entire SEC database to fully analyze public companies behavior on economic changes. Try XBRLAnalyst for free!
If you would like to try XBRLAnalyst for Excel or iXBRLAnalyst, just register for a test drive (no Credit Card required!)
If you need assistance building Excel models that leverage XBRLAnalyst tools, contact us at support@findynamics.com.
For video tutorials, visit our website or subscribe to our Youtube channel. To follow our posts and updates, please add our Twitter and Facebook accounts. For more information, please consult our Knowledge Base.
Image and article originally from findynamics.com. Read the original article here.