
By Vitya Vitya In General
This analysis was performed using Fundamental and Stock market data provided with XBRLAnalyst for Excel
The original data and all the analysis is available in the Excel file
To say that the global economy is volatile would be an understatement. Inflation – caused among other factors by the war in Ukraine with no end in sight – has pushed energy and food prices to near unbearably levels for many. In response, central banks are expected to hike interest rates. This will affect investment and could push economies into prolonged recession.
With interest rate hikes and low growth/ recession for major economies seeming inevitable, many stock prices are not expected to do well either. Given the economic climate, a safe bet could be the healthcare sector as it is indispensable. Stock analysis, of course, is carried out by any rational investor in making a buy/sell/hold decision.
The excel file shows important components to help in this decision-making process, i.e, market, financial, and valuation data analysis.
Gross profit margin is the portion of revenue left (after deducting the cost of goods sold) as a percentage of revenue. It is the most basic level profitability index and shows the efficiency of a company’s production: the higher, the better. Within the portfolio of companies analyzed, Centene Corp ranks highest, followed by Edwards Lifesciences Corps, etc.
Another very important metric that could predict future sales for companies in the health sector is Research and Development expenses. This is particularly true for drug development companies. Thus, it is no surprise that Gilead Science, Inc and Eli Lilly and Co, both in the medical manufacturing industry, have the highest R&D expenses. On the other spectrum, Hospital and Medical Service Plans have no R&D expense due to the non-discovery nature of their services.
Stock price changes give an insight into what the market thinks about the future earning potential of the company. Hence, an increase in this metric is always welcomed. While Stryker Co.shows the highest gain over the quarter, perhaps looking at a longer period might give a clearer insight. Moderna’s share price has lost 22% of its value in the same quarter, the highest in the portfolio. This might be due to reduced demand for Covid vaccines, which pushed its share price through the roof. While Moderna’s share price is significantly higher than pre-pandemic levels, it is worth pointing out that it has lost 70% of its value since it peaked in September 2021.
While liquidity ratios are generally more important for SMEs than multinationals due to the latter reputation and borrowing abilities, the upcoming predicted economic troubles of many advanced economies will make the liquidity in the global climate comparatively more scarce. Thus, companies will generally find borrowing more difficult relative to the past years, and perhaps more importantly, much more costly given the interest rate hikes promised by major central Banks. Generally, a quick ratio of one is deemed sufficient. However, looking at the portfolio, Edwards Lifesciences Corp and Intuitive Surgical Inc. are major outliers.
The debt-to-equity ratio shows the proportion between the company’s debt to the shareholders’ equity. Alternatively, the extent to which debt is used in the overall financing of the company. When comparing similar companies, a higher debt to Equity ratio suggests a relatively higher risk. However, when this metric is too low, it suggests that the company is not taking advantage of its debt capacity. McKesson Co stands out with its negative ratio indicating negative equity, a worrying sign for any company.
In a hypothetical case where an investor wants to invest a thousand dollars, the valuation component of the file provides important metrics. The most common way to evaluate a stock is the PE ratio – the price investor pay for a stock relative to its earnings. Based on the pe ratio of the portfolio analysis, Moderna is the best option as it is the lowest. The same conclusion can be derived from both the EV/EBITDA and EV/GP. The EV/Revenue, however, suggests that the Cigna group would provide the best value for investors. While Moderna ranks best on three out of four of the valuation indices, which on face value suggests the best value for money, Moderna’s stock prices are on a downward trend. Whether an investor thinks that the trend will continue or not will be crucial in the decision-making process of investing in this stock.
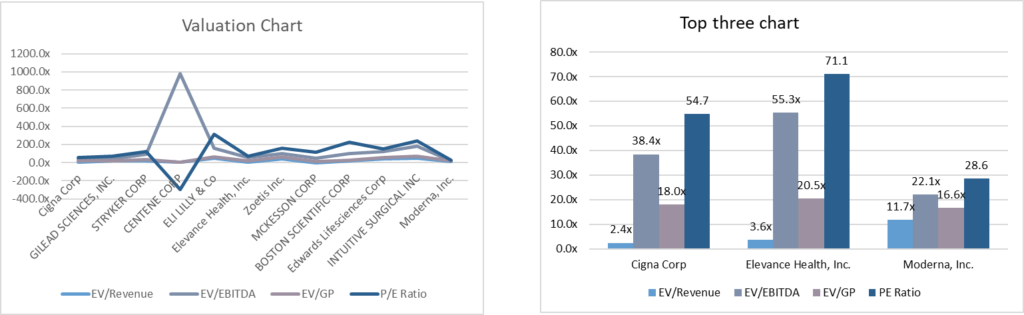
Image and article originally from findynamics.com. Read the original article here.