
By Len In General
Yes it’s true… We have an online version called iXBRLAnalyst in Google Sheet where you can analyze financial data of S&P100 companies for free!
First click our knowledge base link to know more about it: Online XBRLAnalyst in Google Sheet
Then download the free template we will be using here from our website: iXBRLAnalyst, choose Example 3
iXBRLAnalyst Monitoring S&P100 Companies is a free Google sheet template ranking the listed industries and companies with the highest returns, then automatically updates itself as to the latest filings in live SEC database. Here how it works:
“SP100Companies” Sheet shows all the 100 companies in S&P100 index, arranged to highest Return on Investment (ROI) while “TopIndustries” Sheet is the pivot table ranking all related “Industry Sectors” as to the count of included companies.
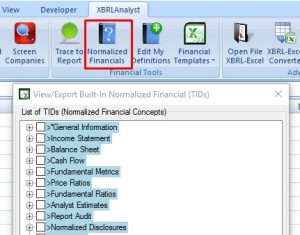
It basically works the same as XBRLAnalyst in Excel, except that its functions are limited only to XBRLFact, Finvalue, Shareprice and Finstats. Basically with these functions, you can start a simple analysis. Then, to know the metrics available for comparison check the Desktop version’s Normalized Financials:

Each column in this template shows the details of the companies as to their SIC Description (industry sector of each company), Company Name, Ticker, latest SEC filed Reported Period with Ending Date, financial metrics such as ROI, P/E ratio and the latest Shareprice from real-time database of stock market data from all U.S. equity markets.

Then the “TopIndustries” ranks the sectors with the highest number of related companies. Rank 1 goes to Pharmaceutical Preparations with 7 companies. This ranking will give an idea of the top performing industry in the current market.

Next, filter all companies from this sector – BMY, JNJ, ABBV, LLY, PFE, MRK and ABT.

By simply looking at the data, we can tell which company has the highest return and the lowest shareprice. To add more benchmarking tools, continue with XBRLAnalyst excel add-in using “Compare Companies” resulting to a report like below:

Of course, XBRLAnalyst with robust Excel functions will let you visualize the report. The result, an excel template ready for presentation:
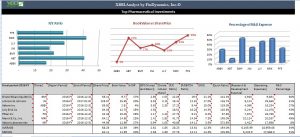
In this analysis, top companies are MRK, PFE, BMY and ABT due to high P/E ratio, market valuation and R&D confidence. Have a look at this article sharing the same views on pharmacies for long-term investments.
Once you have a subscription, you can use both XBRLAnalyst and iXBRLAnalyst with no additional registration needed. Moreover, we have an open source project called iXBRLAnalyst-VBA which is a strictly VBA based Excel Add-in working on both Windows and Mac platforms linked to your subscription too! Yes that’s right, our service is everywhere. Whether Excel, Google Sheet, Windows, Mac, VBA, all these are available to try for free!
So try XBRLAnalyst now and start building financial reports wherever you are, on whatever applicable means you have.
If you would like to try XBRLAnalyst for Excel or iXBRLAnalyst, just register for a test drive (no Credit Card required!)
If you need assistance building Excel models that leverage XBRLAnalyst tools, contact us at support@findynamics.com.
For video tutorials, visit our website or subscribe to our Youtube channel. To follow our posts and updates, please add our Twitter and Facebook accounts. For more information, please consult our Knowledge Base.
Image and article originally from findynamics.com. Read the original article here.