

MONDAY’S CLOSE RELATIVE TO HISTORICAL THRUSTS
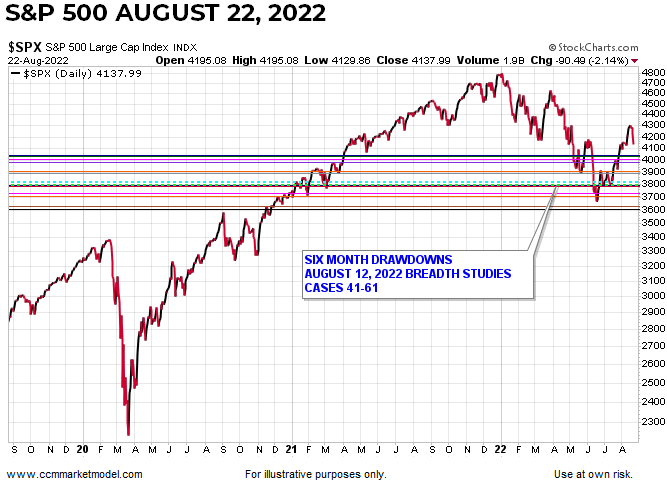
While there are numerous examples of shorter-term risk-off behavior in the past two sessions, we have not seen anything yet that falls outside of the historical norms for breadth thrusts. The average hypothetical drawdown, based on the 61 signal dates covered in the August 12 video, comes in at 4035. The median drawdown comes in at 4106. The S&P 500 close of 4138 on Monday stands 103 points above the average historical drawdown.
The median number of calendar days to the maximum historical drawdown low was 10. The average number of calendar days was 29. Thus, based on the signal dates in 2022, a similar drawdown would conclude hypothetically between August 21 and September 8. From both a magnitude and time perspective, the current drawdown is not abnormal. Looking a little deeper into the breadth signals that were recently flashed, the S&P 500 hypothetical drawdowns are shown below based on the historical cases with the largest drawdowns. The S&P 500 could pull back to the 3600-4000 range and remain within the historical drawdown window.
Historically, investors that were patient during post-thrust volatility were rewarded over the next two years. The average one-year S&P 500 gain from the date of the signal was 25.34%. The average two-year S&P 500 gain was 39.25%. The comments and data in last Friday’s video (below) still apply.
INFLATION AND THE FED
We will continue to monitor things closely while making no assumptions about how things unfold. Friday brings an important reading on inflation and Jay Powell’s Jackson Hole speech.
Image and article originally from www.ccmmarketmodel.com. Read the original article here.