
Prudent Investments.
( Invest With Prudence. )
Short Term View.
Titan Ichimoku Chart.

As per the charts above
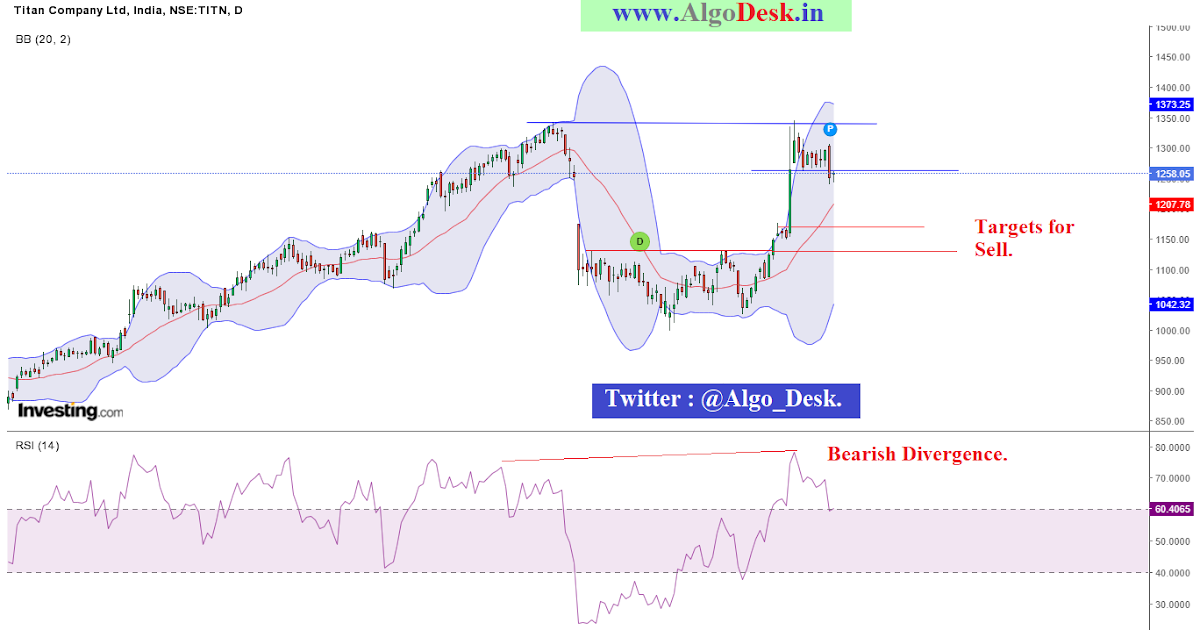
Titan has broken its support and has closed below it.
Most importantly this support has been broken after forming a Double Top.
Another important point to be noticed is , at the time of Double Top Formation, RSI has formed a Bearish Divergence, which acts as a supporting tool to BO of support.
However, i would wait for appropriate Price Action, before entering into a trade , due to the fact that in the current scenario the Risk : Reward does not match. ( Daily basis. )
Once this hindrance is passed, we may see Titan coming down to app 1150 – 1170,
If someone has to take a trade in the current scenario, then one can go short even at CMP, with SL in spot above 1266 (15 M closing basis )………..Targets being the same.
The ichimoku chart suggests that this target can be achieved in a time frame of about 8 – 10 days, provided the trade is taken with correct Risk : Reward.
Note :
I am not a SEBI registered Investment Adviser and my accuracy is not guaranteed. My posts are my personal views and for information / educational purpose only.
Therefore, kindly, do your own research or consult your adviser before trading or making any investment.
I am a Trainer & Mentor, for those who wish to learn Technical Research in Capital Markets. My ambition is to make you self – sufficient, by teaching you from Basics of Technical Analysis to High Probability Trade Setups, so that you gain expertise and make money / create wealth for yourself.