Investors in innovation tend to focus on the US exclusively, and some of that is for good reason as the US spends more than any other country on research and development. But there are many innovative companies outside the US that spend substantial sums on research and development.
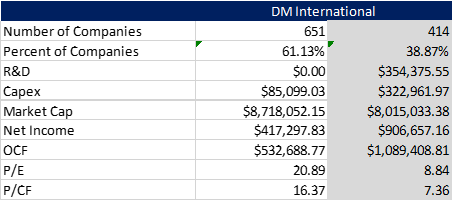
In this exercise, I am going to use the Morningstar Developed Markets Large-Mid Index. I remove any companies that are domiciled in tax havens (Bermuda, Luxembourg, etc.). I also am going to focus on Europe and Asia, excluding Canadian and Mexican companies from the analysis. So, we have left companies from the Developed Europe and Asian countries. The table below summarizes the data we’ll be referring to.
Of the 1,065 international companies identified in this analysis, I broke them out into two groups. The first column is the companies that spend nothing on R&D, and the second column is the companies that do spend on R&D. There are 414 companies that we identified outside the US that invest in research and development. This is roughly twice as many US companies in the index that invest in research and development.
These international companies spent, in aggregate, $354B on R&D in the trailing twelve months relative to $322B in capital spending. The non-R&D spenders generated about $417B in net income in the trailing twelve months and $532B in operating cash flow, according to Bloomberg data. The group of R&D spenders, which is about 39% of the total universe of equities considered here, generated an adjusted net income of $906B and adjusted operating cash flow of $1.09B. The “adjustment” here is simply adding back R&D investments to net income and cash flow, treating corporate investments in R&D similarly to corporate capital expenditure.
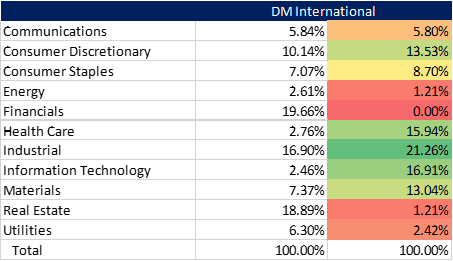
The composition of the international innovators is quite diverse, spanning 10 of the 11 GICS sectors. In the international universe of innovators there are significantly more companies outside of the traditional innovation-centric technology and health care sectors. In fact, the largest sector weight among international innovators is the industrial sector.
Next, I wanted to look at the distribution of R&D spending among US companies relative to international. The table below summarizes the results.
Among domestic innovators, the top 10 R&D spenders represent 53% of all R&D spending in the US. In Europe it is over 70% and in Asia it is only 36%. When I broaden the lens and consider the top 20 R&D spenders, the picture changes somewhat. In the US, the top 20 R&D spenders account for 67% of all R&D spending while in Europe it is 53% and in Asia it is 51%. So, R&D spending in the US is much more concentrated among the largest firms, while internationally R&D spending is more broadly based than the top 20 companies.
While many investors maintain a homefield bias and relegate investments to the US, they are missing huge pockets of innovation around the world. Whether it is European industrial or Asian consumer staples, there are many companies outside of the US technology sector that spend heavily on R&D. Considering these international innovators allows one to construct a globally diversified portfolio of the most innovative companies.
Image and article originally from www.knowledgeleaderscapital.com. Read the original article here.


