
By Jerry In General
Introduction
Investing in stocks is always a delicate and complex task where you will have to understand the market dynamics, local financial laws and regulations. Generally, there are two types of analysis i.e., technical and fundamental. Technical analysis is often done by Day Brokers whose objective is to gain profit within a short period of time (some hours, days, or weeks) whereas fundamental analysis is performed by the financial analysts and stocks investors whose objective is to grow wealth on a relatively longer period but with less risk. Here we will concentrate on the fundamental analysis.
Before choosing a stock to buy, you will have to go through the key financial metrics of each company to better understand the company’s performance in absolute terms and in comparison with its competition on the market. Although reliable financial data can be obtained from the company’s periodic financial statements filed to the SEC (Securities and Exchange Commission) or from the company’s Investor Relations webpage (example for Coca-Cola), searching and aggregating that data in proper financial models in Excel is a time-consuming task. There are several financial data systems that can simplify and speed up that task such as Bloomberg, FactSet, Google Finance, Yahoo financial data, and XBRLAnalyst by FinDynamics. Many investment brokers provide their own custom solutions, which are not necessarily as flexible and convenient as Excel models.
What financial data to check before buying stock
Fundamental analysis has the following objectives:
- understand patterns in company’s financial performance
- validate company’s performance against its competitors using key metrics
- predict future company value and hence stock price growth using data from financial statements.
In our analysis of Soft drinks stocks, we combine two groups of financial metrics: those that are common to any company and others that are specific to the industry of soft drinks producers.
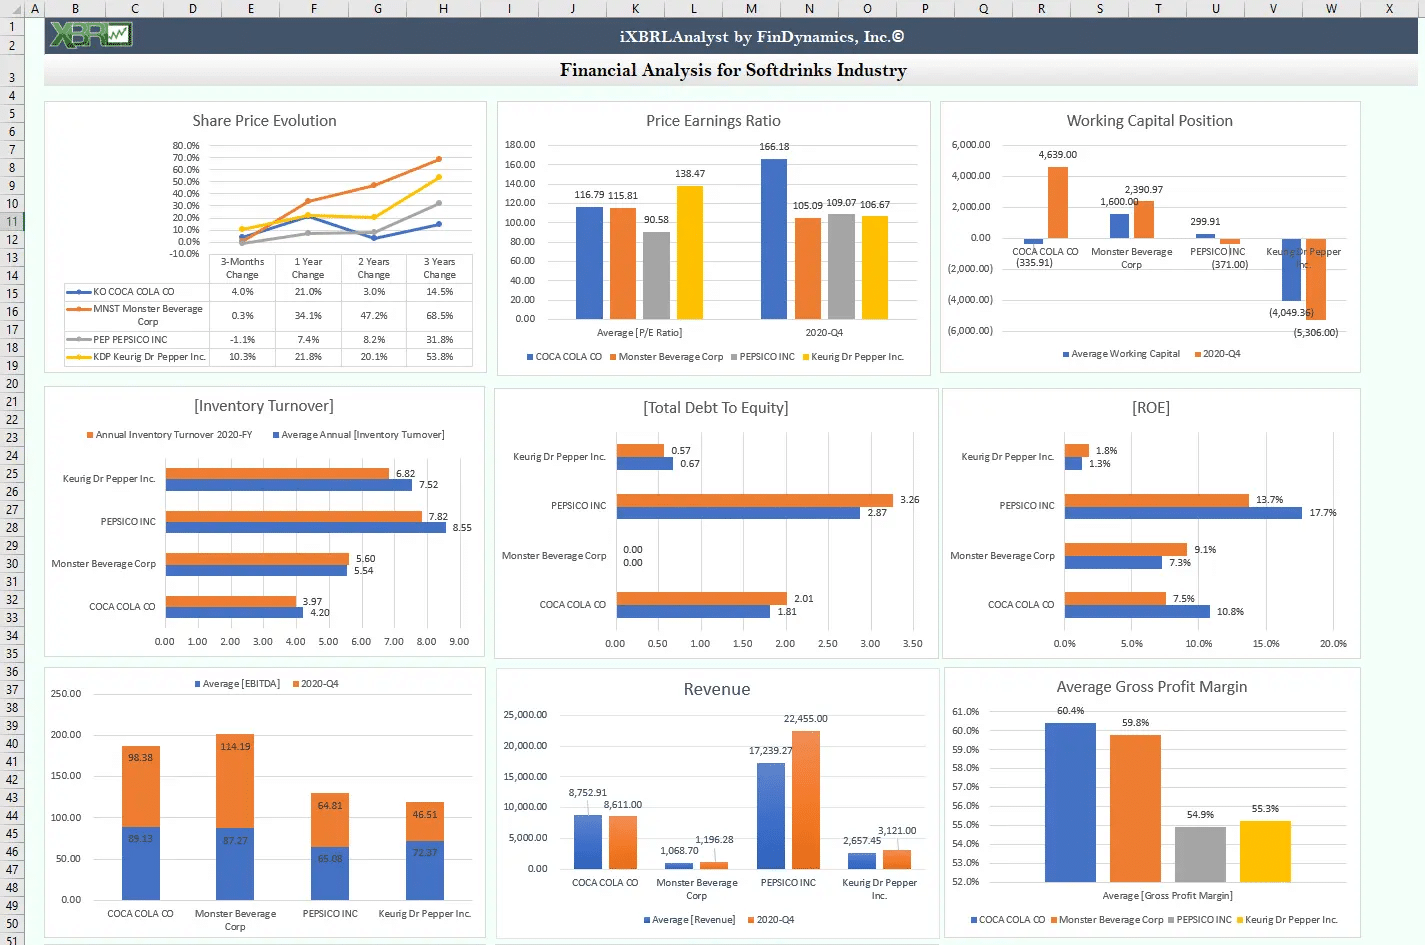
Among the common financials to check before considering a stock for investment, we analyzed stock price evolution, price to earnings ratio, market capitalization, gross and net profit margins, revenue and return on equity, and total debt to equity ratio. These financial performance metrics should be evaluated preferably on a long-term basis from 3 to 5 years. Under the group of industry-specific metrics, we included Working Capital, Inventory Turnover, and Enterprise Value to EBITDA ratio.
Some of the financial data referenced above is easy to find and view on the web. For instance, producing a graph of stock price evolution is a common feature of many free and paid tools, e.g. Nasdaq’s stock’s monitor. However, when you need to compare multiple stocks and combine or correlate them with other data, such a task is much easier to do in Excel. Moreover, even you want to save and repeat that same analysis again later, you quickly come to a realization that Excel is the best option.
For such analysis, you do not have to know accounting to read and understand the financial statements (Income Statement, Balance Sheet, Cash Flow Statement, etc.) or spend time gathering data manually or paying a fortune for some institutional platforms like Bloomberg. All that financial data collection and analysis can be done automatically in Excel for any other company using the Excel model provided in our article because it already has the required Excel formulas from XBRLAnalyst to get the necessary data from the financial reports and from the stock market.
Results of our financial analysis
Based on our comparative and fundamental analysis in XBRLAnalyst, Monster Beverage Corp (MNST) stocks have considerable potential for investors due to the following points:
- Stock value growth is 56% over a period of the last three years.
- Gross Profit Margin is 58%
- Profit margin is 28% which keeps it at the top of the list.
- Possibility to capture more market share (see market capitalization graph) as it has currently little share as compared to its competitors, thus gives more space to grow.
- Net working capital shows a solid liquidity situation, effective operational efficiency, and ability to meet short-term obligations as compared to its competitors.
- In the absence of long-term credit risk (Total Debt to Equity = 0%), ROE (Return on Equity) ratio is 9% which seems to be quite interesting for prudent investors

What else to consider
When you make investments, it is important to follow some best practices and rules validated by many top Asset managers on the market. Three guidelines below should help follow such best practices.
Make a list of your Expectations: Your Financial Goals: Ascertain your Risk Tolerance Level: Learn about the Market Dynamics: our expectation from the Stock Market: Evaluate Economic Situation
- How to Invest in Stocks Market:
Decision on Asset Allocation: Stocks Selection: Calculation of Stocks real value (Valuation of Stocks through techniques, models etc.): Purchase your Shares (Direct and Indirect Approach): Portfolio Diversification: Investment Period (From Short to Long Term): Regular Investment
- Your Portfolio Follow-up:
Benchmarks Creation: Comparison in between Goals and Stocks Performance: Tailor your Portfolio as per Stock and Market Changes: Excessive Trading can kill the Stocks Performance.
Image and article originally from findynamics.com. Read the original article here.