
By Len In General
We recently found this interesting article about companies with good yield history. We all know that high dividend pay easily attracts investors, but it doesn’t end there. Company’s stability, liquidity and other economic considerations can also determine stock price, also an attractive factor. But since we intend to help our investors decide on issues like this, let’s start digging the financial data of the three companies mentioned in the article – Exxon (Mobil (XOM), Helmerich & Payne (HP) and Target (TGT).
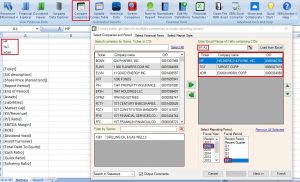
First, we will use “Compare Companies” feature and load the tickers from Excel.

Then, choose the metrics to compare from Normalized Financials. We will also include disclosures related to Total Debt. We all know that debt market is also a source of company funds.

Next will be Report Style, Style 2 without median or average. They don’t have the same industry sector, so we don’t need comparison on related factor.

In below report, it clearly showed that these companies do not have the same reporting periods. Meaning, some economic factors or specific events are not considered in comparison which might be affecting the financial values. We can say that having its 2016-FY period ended Sep. 30, 2016, Helmerich & Payne’s data have not reflected the economic effect of the newly elected US President who was inaugurated on last quarter of 2016.

Having consideration like this, it will be more relevant and logical to compare these companies on the same or most concurrent calendar period. By using “Last Twelve Months” (LTM) period code, the function will calculate 12 months backward from the latest applicable period for these three companies’ financial values.
Applying “LTM” period code to XBRLFact function, the system now set for their last twelve month’s financial data:

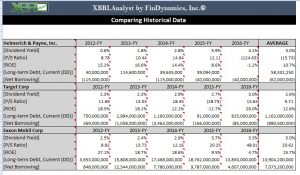
Now, we can identify which data to dig. Normally, negative or missing values instantly attract attention, so lets get the historical data of [P/E Ratio], [ROE] and [Long-term Debt, Current (DD)], as well as [Net Borrowing] and [Dividend Yield]. Using “Historical Data” feature, we will retrieve each metric’s 5-year historical values:


Then, get the average of the values to analyze each company’s yield, earnings and debt.
Dividend Yield – all companies have remarkable yields for straight 5 years.
P/E Ratio and ROE – Exxon Mobil stays positive despite the past years’ economic downturn, TGT and HP were somehow affected on years 2015 and 2016 respectively.
Long-term Debt, Current and Net Borrowing – though we cannot directly compare the 3 companies on the debt values as they have different sector and cap, still we can conclude that Exxon Mobil has a consistent debt funding. TGT and HP, on the other hand, were repaying their debts for the past 5 years.
Aside from dividends, financial factors such as historical earnings and debt must also be considered. These companies might continue their positive yield track, but analysis like this will tell you more about investment risk, growth and stability.
This is just an example of how easy and fast you can analyze financials. Compare Companies and Historical Data are just two of the many features of XBRLAnalyst that will help you understand investments better Dig deeper into companies’ financials and let XBRLAnalyst tells you more!
If you would like to try XBRLAnalyst for Excel or iXBRLAnalyst, just register for a test drive (no Credit Card required!)
If you need assistance building Excel models that leverage XBRLAnalyst tools, contact us at support@findynamics.com.
For video tutorials, visit our website or subscribe to our Youtube channel. To follow our posts and updates, please add our Twitter and Facebook accounts. For more information, please consult our Knowledge Base.
Image and article originally from findynamics.com. Read the original article here.